How to calculate Z-Scores in Python
What you will learn
- Learn the definition of a z-score;
- Be able to calculate z-scores in Python;
- Gain confidence in interpreting z-scores.
Table of Contents
- 1. What is a z-score?
- 2. Python z score using a custom function
- 3. Python z score using SciPy
- 3. Visualising z scores
- 4. Visualizing z scores with Matplotlib
If you’ve worked with statistical data, you’ve likely encountered z-scores. A z-score measures how far a data point is from the mean, expressed in terms of standard deviations. It helps identify outliers and compare data distributions, making it a vital tool in data science.
In this guide, we’ll show you how to calculate z-scores in Python using a custom function and built-in libraries like SciPy. You’ll also learn to visualize z-scores for better insights.
1. What is a z-score?
A z-score measures how many standard deviations a data point is from the mean. The formula for calculating the z-score of a data point X is:
\[Z_{X} = \frac{X - \overline{X}}{S}\]Where:
- \(Z_{X}\) is the z score of the point \(X\);
- \(X\) is the value for which we want to calculate the Z score;
- \(\overline{X}\) is the mean of the sample;
- \(S\) is the standard deviation of the sample.
2. Python z score using a custom function
A custom function allows you to implement the z-score formula directly. Here’s how to define and use it in Python:
content_copy Copy
def calculate_z(X, X_mean, X_sd):
    return (X - X_mean) / X_sd
The function takes three arguments:
- a vector X of values for which you want to calculate the z-scores, like a pandas dataframe column, for example;
- the mean of the values in X;
- the standard deviation of the values in X.
Finally, in the return clause, we apply the z-score formula explained above.
To test our function, we will use data from Playfair (1821). He collected data regarding the price of wheat and the typical weekly wage for a “good mechanic” in England from 1565 to 1821. His objective was to show how well-off working men were in the 19th century. This dataset is available in the HistData R package and also on the webpage of Professor Vincent Arel-Bundock, a great source of datasets. It consists of 3 variables: year, price of wheat (in Shillings) and weekly wages (in Shillings).
We will be calculating the z-scores for the weekly wages. First we load the dataset directly from the website, as indicated in the code below.
content_copy Copy
import pandas as pd

data = pd.read_csv("https://vincentarelbundock.github.io/Rdatasets/csv/HistData/Wheat.csv")

print(data['Wages'].mean())
print(data['Wages'].std())

data["z-score_wages"] = calculate_z(data["Wages"], data["Wages"].mean(), data["Wages"].std())
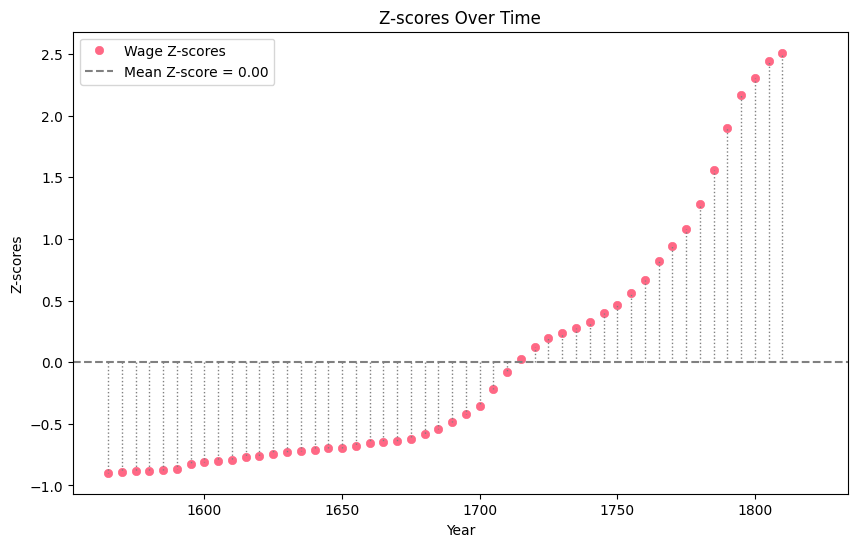
The average weekly wage during the period was 11.58 Shillings, with a standard deviation of 7.34. With this information, we can calculate the Z score for each observation in the dataset. This is done and stored in a new column called “z-score_wages”.
If you check the first row of the data frame, you will find out that in 1565 the z score was around -0.9, that is, the wages were 0.9 standard deviations below the mean of the values for the whole period.
3. Python z score using SciPy
A second option to calculate z-scores in Python is to use the zscore method of the SciPy library as shown below. Ensure you set a policy for handling missing values if your dataset is incomplete.
In the code below, we calculate the z-scores for Wheat prices. If you look at the z-score summary statistics, you will see that the price of wheat varied between -1.13 and 3.65 standard deviations away from the mean in the observed period.
content_copy Copy
from scipy import stats

data["z-score_wheat"] = stats.zscore(data["Wheat"], nan_policy="omit")

data["z-score_wheat"].describe()
3. Visualising z scores
Below you can better visualize the basic idea of z scores: to measure how far away a data point is from the mean in terms of standard deviations. This visualization was created in D3, a JavaScript library for interactive data visualization. Click “See average wage” to see the averave wage for the whole period. Then check out how far from the mean each data point is and finally note that the z-score consists of this distance in terms of standard deviation.
4. Visualizing z scores with Matplotlib
The code below plots the wage z scores over time and shows them as the distance from the point to the mean, as demonstrated in the D3 visualization above. Please consult the lesson ‘Storytelling with Matplotlib - Visualizing historical data’ to learn more about Matplotlib visualizations.
content_copy Copy
# Calculate mean wage
mean_wage = data["z-score_wages"].mean()

# Create the plot
fig, ax = plt.subplots(figsize=(10, 6))

# Scatter plot of wages over years
ax.plot(data["Year"], data["z-score_wages"], 'o', color='#FF6885', label="Wage Z-scores", markeredgewidth=0.5)

# Add a horizontal line for the mean wage
ax.axhline(y=mean_wage, color='gray', linestyle='dashed', label=f"Mean Z-score = {mean_wage:.2f}")

# Add gray lines connecting points to the mean
for year, wage in zip(data["Year"], data["z-score_wages"]):
    ax.plot([year, year], [mean_wage, wage], color='gray', linestyle='dotted', linewidth=1)

# Customize the plot
ax.set_xlabel("Year")
ax.set_ylabel("Z-scores")
ax.set_title("Z-scores Over Time")
ax.legend()

# Show the plot
plt.show()
Have questions or insights? Leave a comment below, and I’ll be happy to help.
Happy coding!
Conclusions
- A z score is a measure of how many standard deviations a data point is away from the mean. It can be easily calculated in Python;
- You can visualize z-scores using traditional python libraries like Matplotlib or Seaborn.
Comments
There are currently no comments on this article, be the first to add one below
Add a Comment
If you are looking for a response to your comment, either leave your email address or check back on this page periodically.